- Authors: Z. Zhang, M. Kamon, L. Daniel
- Sponsorship: Coventor, Inc.
The voltages at which MEMS actuators and sensors become unstable, known as pull-in and lift-off voltages, are critical parameters for almost any design. However, current general-purpose simulators compute these critical parameters by directly sweeping the voltage, leading to either excessively large computational cost or convergence failure near the instabilities. This work applies two kinds of continuation methods to simulate the pull-in and lift-off effects.
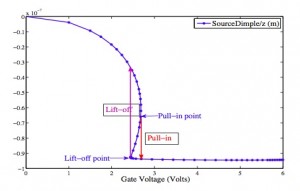
The first algorithm uses arc-length continuation algorithm to compute the multiple static solutions of a given MEMS design. Using a tangent predictor and a correction scheme, a next solution point can be calculated based on the previous solution point. This method can efficiently avoid the convergence failures of Newton iterations when a direct sweeping method is applied to solve for the static solutions[].
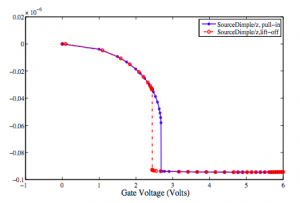
The second algorithm uses a different idea to generate a single-solution curve. The basic idea is that we first apply arc-length continuation until a pull-in or lift-off point is approaching. After that, a homotopy method is applied to directly solve for the next point after a sharp transition of the solution curve.
Both algorithms have been implemented in a commercial MEMS+IC co-design software package, and they have been tested by various industrial MEMS design cases. Figures 1 and 2 show that the simulation results from both algorithms are the same. These results are consistent with that from a commercial simulator, CoventorWare, which utilizes detailed but time-consuming finite-element and boundary-element analysis.
-
-
Figure 1: Simulation results of the first kind of continuation algorithm. The pull-in and lift-off voltages are 2.68 V and 2.44 V, respectively.
-
-
Figure 2: Simulation results of the second kind of continuation results. The blue curve shows that pull-in happens at 2.683V; the red curve shows that lift-off happens at 2.442 V.
- Authors: Z. Zhang, T. A. El-Moselhy, I. M. Elfadel, L. Daniel
- Sponsorship: Masdar Institute of Science and Technology, MIT Cooperative Agreement
Design and fabrication uncertainties have become an important issue in nano-scale integrated circuit design. Such uncertainties are typically randomly distributed, as described by probability density functions extracted from measurements. Such device-level uncertainties can propagate to the upper circuit level, leading to significant variations in circuit performances (such as power dissipation, small-signal gain, clock frequency, etc.) As a result, many performance metrics become uncertain in today’s IC design. Therefore, it is highly desirable to develop efficient electronic design automation (EDA) tools to capture the variations in various design levels.
This work develops a non-Monte Carlo stochastic circuit simulator for uncertainty quantification of nonlinear circuits. This simulator is based on generalized polynomial chaos (gPC) and a newly developed stochastic testing scheme. The gPC allows our platform to simulate integrated circuits with both Gaussian and non-Gaussian random parameters. Meanwhile, the stochastic testing method allows using fast decoupled numerical solvers with adaptive time stepping, leading to superior efficiency over existing stochastic Galerkin and stochastic collocation methods. Different types of simulations (such as DC, AC, transient, periodic steady-state) are implemented, and they are tested on several analog, RF, digital circuit netlists, as well as power electronic circuits, including both forced and autonomous circuits. Significant speedup is observed compared with Monte-Carlo simulation, as well as existing intrusive and non-intrusive spectral methods.
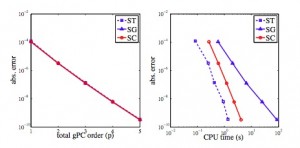
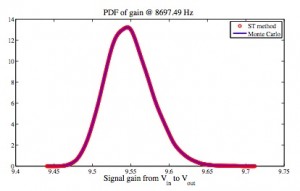
Figure 1 compares the numerical errors of our ST method with stochastic Galerkin (SG) and stochastic collocation (SC), using a CMOS low-noise amplifier (LNA) as an example. Clearly, the proposed ST solver has an accuracy similar to that of SG and SC methods. However, ST is more efficient over the existing spectral methods. Figure 2 shows the AC analysis results using our ST method versus standard Monte Carlo simulation. Both methods produce the same statistical distribution for the signal gain, but our proposed ST method is about 700 times faster.
-
-
Figure 1: The numerical errors as a function of polynomial order and simulation time.
-
-
Figure 2: Small-signal gain of a BJT feedback amplifier, obtained by proposed ST method versus Monte Carlo simulation.
- Authors: Z. Zhang, T. A. El-Moselhy, P. Maffezzoni, I. M. Elfadel, L. Daniel
- Sponsorship: Masdar Institute of Science and Technology, MIT Cooperative Agreement
Designers are particularly interested in periodic steady-state (PSS) analysis when designing analog/RF circuits or power electronic systems. Such circuits include both forced (e.g., amplifiers, mixers, power converters) and autonomous cases (also called unforced circuits, e.g., oscillators). Popular PSS simulation algorithms include shooting Newton, finite difference, harmonic balance, and their variants. As devices scale down to the nanometer scale, almost all performance metrics are influenced by manufacturing process variations. This work focuses on the uncertainty quantification (UQ) of PSS solutions influenced by process variations.
Specifically, this work proposes a simulator for the UQ of PSS solutions based on the stochastic testing (ST) method[]. After expressing the node voltages and branch currents as a truncated generalized polynomial chaos (gPC) expansion, we apply the shooting Newton method to solve for the PSS gPC coefficients. For forced circuits, the shooting Newton method is directly applied to the resulting ST formulation. For unforced circuits, since the oscillation period depends on statistical device parameters, a scaling scheme is applied to the time axis before applying shooting Newton. For both forced and autonomous circuits, decoupled solvers are developed to accelerate the numerical computation.
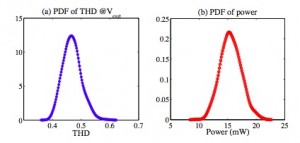
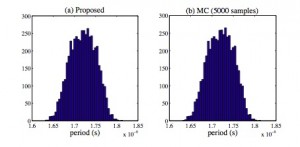
Our algorithms have been tested by several analog/RF circuits with both Gaussian and non-Gaussian random parameters. Figure 1 shows the calculated density function of the total harmonic distortion (THD) and power dissipation of a CMOS low-noise amplifier (LNA) under threshold voltage variation and linear device mismatch. Using our decoupled solver leads to 13 times of speedup. Figure 2 shows the histograms of the frequency of a BJT Colpitts oscillator, simulated by our proposed PSS UQ tool and standard Monte Carlo with 5000 samples. Both methods produce the same statistical distribution for the signal gain, but our ST method is about 700 times faster. Both methods achieve the same level of accuracy (with 1% error), but our proposed UQ tool is about 428 times faster than the conventional Monte Carlo simulator.
-
-
Figure 1: Density function of the total harmonic distortion (THD) and power consumption of a low-noise amplifier (LNA) from our proposed solver.
-
-
Figure 2: Histograms of the oscillation frequency of a Colpitts oscillator, obtained by our proposed simulator (left) and standard Monte Carlo simulation (right).


