Wide-field Multispectral Super-resolution Imaging Using Spin-dependent Fluorescence in Nanodiamonds
- Category: Nanotechnology, Optics & Photonics
- Tags: dirk englund, edward chen
Recent advances in fluorescence microscopy have enabled spatial resolution below the diffraction limit by localizing multiple temporally or spectrally distinguishable fluorophores. Here, we introduce a super-resolution technique that deterministically controls the brightness of uniquely addressable, photo-stable emitters (see Figure 1)[1]. We modulate the fluorescent brightness of negatively charged nitrogen-vacancy (NV–) centers in nanodiamonds through magnetic resonance techniques. Using a CCD camera, this “deterministic emitter switch microscopy” ” (DESM) technique enables super-resolution imaging with localization down to 12 nm across a 35×35μm2 area (See Figure 2). DESM is particularly well suited for biological applications such as multispectral particle tracking since fluorescent nanodiamonds are not only cytocompatible but also non-bleaching and bright.
We have introduced a deterministic emitter switching technique to pinpoint the position of NV– centers below the diffraction limit with resolution comparable to super-resolution stochastic methods. Several other techniques developed in recent years employ multiple optically distinguishable emitters for super-resolution single-molecule tracking. As DESM can potentially distinguish up to 55 different emitters in a spot, it offers the largest number of spectral channels reported to date for multispectral fluorescence microscopy. Super-resolution imaging using fluorescent nanodiamonds holds several advantages over other fluorescent markers for biological applications, including photostability, cytocompatibility, and high-resolution magnetic and electric field sensitivity. Furthermore, DESM allows for detecting a high fluorescence intensity exceeding 1.5×10⁶ photons per second for a single NV– center at saturation. In experiments involving biological tissue, we expect two factors that can diminish the signal-to-noise ratio and potentially reduce the number of resolvable emitters: higher background counts and possible rotational diffusion of the nanodiamonds, depending on their location. The high frame rate of up to 0.7 Hz, sub-wavelength localization down to 12 nm, and ability for uninterrupted monitoring of individual emitters make DESM an attractive tool for a range of imaging applications.
-
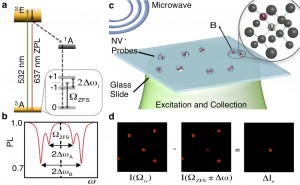
- Figure 1: a. NV- center energy level diagram showing how preferential shelving of ms=±1 excited states (3E) into dark metastable state (1A) gives rise to typical electron spin resonance (ESR) spectrum. b. Fluorescence of two NV- centers in presence of a static magnetic field as function of applied microwave frequency. Splitting of two dips (2ΔωA,B) is given by projecting incident magnetic field on magnetic moment of the NV- center (2gμA,BB). Contrast of each dip has inverted Lorentzian shape with minimum line width limited by dephasing time due to environment (T2*). c. Illustration of NV- centers in static magnetic field, each having field splitting frequencies corresponding to their uniquely oriented magnetic moments relative to magnetic field. To measure ESR spectra across a wide field of view, average fluorescence intensity is measured across hundreds of diffraction-limited sites (dotted circle) while microwave frequencies are swept. d. Schematic diagram of method for resolving a switchable emitter by taking difference between two images where a uniquely addressed emitter is and is not dimmed by resonant microwave excitation, I(ΩZFS±Δω) and I(Ωo), respectively.
-
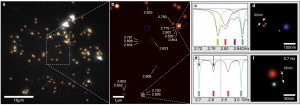
- Figure 2: a. Fluorescence image of nanodiamonds over a 35×35μm2 area. Gold `+’ markings indicate sites with ESR modulation; blue `x’s show no modulation. b. Reconstructed region from (a.) after applying DESM technique; blue circles indicate lack of ESR modulation. Using ESR spectrum at each site and DESM technique, we reconstruct multi-emitter sites over a 7×9μm2 field of view. Numbers correspond to resonance frequencies of each NV- center in site. c. ESR spectrum of a multi-spectral site from (b.). Colored Lorentzian fits correspond to resonances of all four NV- centers in site. d. Sub-diffraction limited reconstruction of four NV- centers in (b) and (c). FWHM from left to right: 26 nm, 15 nm, 12 nm, and 46 nm, respectively. e. Full ESR spectrum of site with two centers. Colored lines indicate Lorentzian fits for each center with arrows indicating resonance frequencies at which images were taken for monitoring mode reconstruction with total acquisition time of 1.44s. f. Monitoring mode reconstruction of site in (b.) and (e.). The FWHM of centers from top to bottom are 53 nm and 24 nm.
- E. H. Chen, O. Gaathon, M. E. Trusheim, and D. Englund, Wide-field Multispectral Super-resolution Imaging Using Spin-dependent Fluorescence in Nanodiamonds Nano Letters 2013. 13, 2073-7 (2013). [↩]