Statistical Modeling with the Virtual Source MOSFET Model
- Category: Circuits & Systems
- Tags: duane boning, li yu
In this work, a statistical extension of the ultra-compact virtual source (VS) MOSFET model is developed here for the first time. The characterization uses a statistical extraction technique based on the backward propagation of variance (BPV) with variability parameters derived directly from the nominal VS model[1],[2]. The resulting statistical VS model is extensively validated using Monte
Carlo simulations and the statistical distributions of several figures of merit for logic, and memory cells are compared with those of a BSIM model from a 40-nm CMOS industrial design kit. The comparisons show almost identical distributions with distinct run time advantages for the statistical VS model. Additional simulations show that the statistical VS model accurately captures non-Gaussian features that are important for low-power designs.
Figure 1 shows the key VS model parameters used for statistical modeling. The threshold voltage is modeled as where is the length-dependent DIBL coefficient. A special feature of the VS model is that is independent of the bias voltages. Previous work has shown that the relative change in virtual source velocity is related to the change in mobility.
According to[1], also has a dependency on. Therefore variation on also has an impact on. In the VS model, both effects are described using an approximation for the sensitivity of with respect to and. In the statistical extraction flow, variations (i = 1, 2, …, m) of electrical performance parameters (e.g., Idsat, Ioff , etc.) are measured under different geometry and bias conditions and the are calculated from BPV according to the formula .
To validate the accuracy of the VS statistical model as well as the statistical extraction method, we also implement it in Verilog-A. The resulting statistical VS model is validated using Monte Carlo simulations, and the statistical distributions of several figures of merits are compared with those of a BSIM model from a 40-nm CMOS industrial design kit. Figure 2 shows a fanout-of-3 static
NAND2 gate operating under a of 0.9V, 0.7V and 0.55V. Although all variation parameters in the VS model are assumed to be independent Gaussian variables, the non-Gaussian property of the delay distribution is correctly captured. The quantile-quantile plot for delay variation starts to deviate from a linear relationship when = 0.7V, and the non-linearity becomes pronounced at = 0.55V.
-
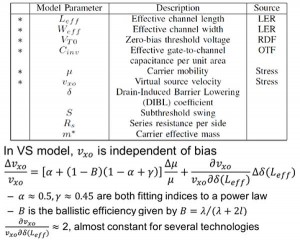
- Figure 1: VS model parameters (statistical parameters labeled as *). v_xo’s dependency on μ and δ(L_eff) are shown in using an approximation for the sensitivity.
-
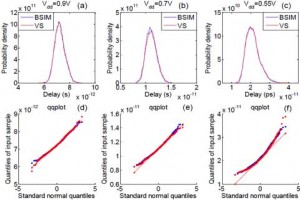
- Figure 2: Delay probability density comparison between BSIM and VS model for an NAND2 gate (fanout of 3) with a supply voltage of (a) 0.9V, (b) 0.7V and (c) 0.55V. The quantile-quantile plot for delay variation under each supply voltage in (d) 0.9V, (e) 0.7V and (f) 0.55V shows a strongly nonlinear pattern in low-power application.
- A. Khakifirooz et al. “A simple semi-empirical short-channel MOSFET current-voltage model continuous across all regions of operation and employing only physical parameters,” IEEE Trans. on Electron Devices, pp. 1674-1680, Aug. 2009. [↩] [↩]
- L. Wei et al. “Virtual-source-based self-consistent current and charge FET models: From ballistic to drift-diffusion velocity-saturation operation,” IEEE Trans. on Electron Devices, pp. 1-9, 2012. [↩]