Sheared Electroconvective Vortices in Electrodialysis
- Category: Energy
- Tags: jongyoon han, rhokyun kwak
We consider electroconvective fluid flows initiated by ion concentration polarization (ICP) under pressure-driven shear flow, a scenario found in many electrochemical devices and systems[1]. Combining scaling analysis, experiment, and numerical modeling, we reveal unique behaviors of ICP under shear flow: unidirectional vortex structure, height selection of the vortex, and vortex advection. Determined by both the external pressure gradient and the electric body force, the dimensionless height of sheared electroconvective vortex is shown to scale as (φ2/ UHP)1/3 (φ:electric potential and UHP: average flow velocity), which is a clear departure from the previous diffusion-drift model prediction[2]. To the best of our knowledge, this work is the first microscopic characterization of ion concentration polarization under shear flow; it firmly establishes electroconvection as the mechanism for overlimiting current in realistic, large-area ion exchange membrane systems such as electrodialysis. The new scaling law has significant implications for the optimization of electrodialysis and other electrochemical systems. Details of experimental and simulation methods appear in[3].
-
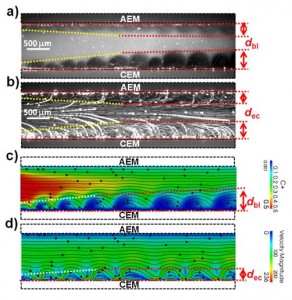
- Figure 1: Sheared ICP is visualized by showing local ion concentration profiles (Figures 1(a) and (c)) and EC vortices (Figures 1(b) and (d)) from experiment (at voltage V=10 V and average flow velocity UHP = 0.83 mm/s (flow rate Q=10 µL/min) (Figure 1(a-b)) and simulation (at V= 25V0 and UHP= 80U0, where V0 =25 mV and U0 =29.66 µm/s) (Figure 1(c-d)). Cation exchange membrane (CEM) (anion exchange membrane (AEM)) is located at lower (upper) side of the channel, and ratio of channel width to length is 1:5 in both experiment and simulation. In the experiment, local ion concentration was tracked with 10-µM Rhodamine 6G (R6G), and circular depletion boundary layers dbl are observed as a dark region caused by depletion of R6G (Figure 2(a)); in simulation, ion depletion is represented as a blue region (Figure 2(c)). Fluid flows were visualized by stacking time-lapse images of 10-µm polystyrene (PS) beads (Figure 2(b)). Vortex evolution is clearly visualized at entrance region in experiment and simulation (yellow and white dotted lines).
-
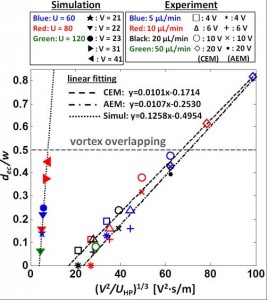
- Figure 2: Dimensionless thickness of EC vortex zone dec/w plotted against the scaling factor (φ2/ UHP)1/3 at various applied voltages and flow rates for both experiment (V = 4-20 V and Q= 5-50 µL/min (UHP =0.42-4.17 mm/s)) and simulation (V=21V0-41V0 and UHP=60U0-120U0, where V0 =25 mV and U0 =29.66 µm/s). Dotted lines are the best fitting straight lines for two different sets of experiment data on CEM and AEM, and one set of simulation data.
- R. Kwak, G. Guan, W. K. Peng, and J. Han, “Microscale electrodialysis: Concentration profiling and vortex visualization,” Desalination, vol. 308, pp. 138-146, Jan. 2013. [↩]
- R. F. Probstein, Physicochemical Hydrodynamics: An Introduction, Wiley-Interscience, 2003. [↩]
- R. Kwak, V. S. Pham, K. M. Lim, and J. Han, “Shear Flow of an Electrically Charged Fluid by Ion Concentration Polarization: Scaling Laws for Electroconvective Vortices,” Physical Review Letters, vol. 110, pp. 114501, Mar. 2013. [↩]