Using Buoyant Mass to Measure the Growth of Single Cells
Understanding how the rate of cell growth changes during the cell cycle and in response to growth factors and other stimuli is of fundamental interest. Over the decades, various approaches have been developed for describing cellular growth patterns, but different studies have often reached irreconcilable conclusions, even for the same cell types. Several factors may contribute to the discrepancies between different growth models: i) cells are minute, irregularly shaped objects; ii) proliferating cells increase their size only by a factor of two, so distinguishing between different cell growth models with mathematical rigor requires highly precise measurements; iii) a wide variety of methods have been used to measure growth, including approaches that average across populations as well as those that monitor individual cells; and iv) a cell’s size includes both volume and mass, which can change at different rates. An ideal method for measuring cell growth rates would directly and continuously monitor the mass and volume accumulation of single unperturbed cells with high precision. In recent years, optical microscopy has been the closest match to this ideal, but volume determination by microscopy has lacked the precision to conclusively distinguish between cell-growth models. Potential alternatives include using fluorescent protein reporters that are correlated with cell size5 or using phase microscopy to measure dry mass during cell growth. We have developed a system that can precisely monitor the growth of single cells in terms of buoyant mass and show that bacteria, yeast, and mammalian lymphoblast cells grow at a rate that is proportional to their buoyant mass (Figures 1 and 2). Buoyant mass is dependent on the amount of biomass in the cell, most of which is denser than water, and so is analogous to the dry mass of the cell.
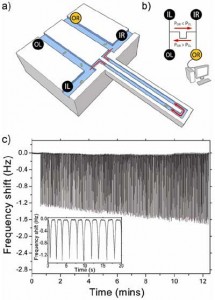
- Figure 1: Dynamic trapping of single cells. (a) Illustration of the suspended microchannel resonator (SMR) trapping a single cell. (b) Schematic of fluidics: sample is injected in parallel through the left and right inlets (IL and IR) and collected at the left and right outlets (OL and OR). While trapping, IL, IR, and OL are kept at the same constant pressure; variable pressure at OR applied by a computer controlled regulator determines the direction of fluid flow in the device. (c) Raw data showing 400 measurements of one B. subtilis cell’s buoyant mass. The frequency shift increase with time indicates cellular growth. Inset: Detail of a few peaks that show a locally stable baseline forms after each pass through the SMR, allowing for drift compensation.
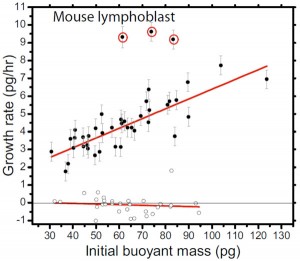
- Figure 2: Growth rate versus initial buoyant mass. Each data point represents a trapped cell and is plotted on the diagram according to the cell’s initial buoyant mass and the measured growth rate during the trapping period. Filled circles indicate normal growing cells, and open circles indicate fixed cells. ) L1210 mouse lymphoblasts from two cultures grown at 37°C. Curve fits are weighted linear regressions. The growth rate errors bars for the growing cells are +- one standard deviation of the growth rate measurements of the fixed cells, except in the cases when the least-squares fitting parameter standard error is greater (due to particularly short trapping times).
References
- M. Godin, F.F. Delgado, S. Son, W.H. Grover, A.K. Bryan, A. Tzur, P. Jorgensen, K. Payer, A.D. Grossman, M.W. Kirschner, and S.R. Manalis, “Using buoyant mass to measure the growth of single cells,” Nature Methods, advanced online publication, April 11 2010 ( doi:10.1038/nmeth.1452).

