Two-dimensional Fourier Transform Electronic Spectroscopy of J-aggregates
J-aggregates are aggregates of organic molecules whose optical properties are characterized by a red-shifted, narrowed absorption band and a larger oscillator strength compared to its smaller molecular components [1]. The fundamental optical excitation in J-aggregates, the Frenkel exciton, can couple strongly to an optical cavity photon, as in room-temperature, polariton-based organic light-emitting diodes [2]. Exploiting the strong coupling limit in J-aggregate/microcavity-based devices requires a narrow exciton line-width that is sensitive to homogeneous and inhomogeneous broadening processes. We investigated exciton dephasing and relaxation of J-aggregates suitable for microcavity-based devices using two-dimensional Fourier transform (2D FT) electronic spectroscopy.

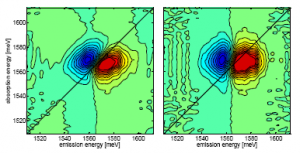
Figure 1: Correlation spectra of a J-aggregate in solution at room temperature for exciton relaxation times T = 0 (left) and T = 860 fs (right). Positive-going features (red) indicate induced absorption into the two-exciton manifold, and negative-going features (blue) indicate exciton bleaching. The change in the nodal angle during the exciton lifetime is related to the rate of spectral diffusion of the exciton.
The 2D FT electronic spectroscopy measurement involves focusing four femtosecond laser pulses into the J-aggregate sample with varying pulse delays and wave vectors and interferometrically detecting the stimulated emission of the exciton with respect to different pulse delays [3]. The signal is Fourier-transformed with respect to the time delay between the first two pulses (the absorption period) and the last two pulses (the emission period) to yield the 2D spectral surfaces shown in Figure 1 for different exciton relaxation times, T, which is defined by the time delay between the second and third pulses. At T = 0 (Figure 1, left) the main spectral features are aligned along the y=x diagonal line, which reveals the ratio of inhomogeneous to homogeneous broadening of the exciton resonance, since the exciton absorption and emission are strongly correlated. As the exciton relaxation time is increased to T = 860 fs (Figure 1, right), the spectral features tilt toward the absorption axis, which reveals a loss of correlation since the exciton can sample different environments as it relaxes.
References
- T. Kobayashi, J-aggregates. Singapore: World Scientific Publishing Co, 1996. [↩]
- J. R. Tischler, M. S. Bradley, V. Bulovic, J. H. Song, and A. Nurmikko, “Strong coupling in a microcavity LED,” Physical Review Letters, vol. 95, pp. 036401:1-4, July 2005. [↩]
- K. Gundogdu, K. W. Stone, D. B. Turner, and K. A. Nelson, “Multidimensional coherent spectroscopy made easy,” Chemical Physics, vol. 341, pp. 89-94, June 2007. [↩]