Liquid Propagation in Micropillar Arrays

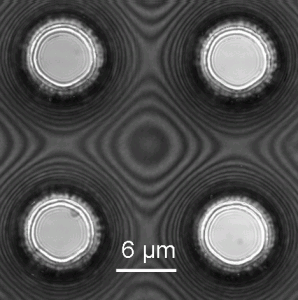
Figure 1: Image of the water meniscus obtained using interference microscopy in a micropillar array where diameter is 6.4 µm and period is 15 µm. Each dark fringe corresponds to half the wavelength of the laser (λ=405 nm) difference in the thickness of the liquid film.

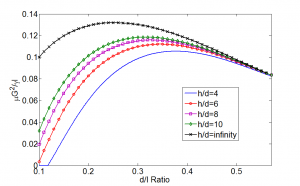
Figure 2: Effective propagation coefficients predicted by the model for varying d/l and h/d ratios, where µ is the viscosity of liquid, γ is the surface tension of the liquid. Variables h, d, and l are the height, diameter and period of the pillar array, respectively. G2 = x/t, where x is the propagation distance and t is the propagation time.
Prediction and optimization of liquid propagation rates in micropillar arrays are important for various lab-on-chip [1], biomedical [2], and thermal management applications [3]. We developed a semi-analytical model based on the balance between capillary pressure and viscous resistance to predict liquid propagation rates in micropillar arrays with height-to-period ratios greater than 1 and diameter-to-period ratios less than 0.57. These geometries represent the most useful regimes for practical applications requiring large propagation rates. The capillary pressure was obtained using an energy approach in which the meniscus shape was predicted using Surface Evolver simulations and verified by interference microscopy. The interference microcopy image of the liquid meniscus is shown in Figure 1. The viscous resistance was determined using Brinkman’s equation [4] with a numerically obtained permeability [5] and corroborated with finite element simulations. The model shows excellent agreement with one-dimensional propagation experiments of de-ionized water in silicon micropillar arrays, which highlights the importance of capturing the details of the meniscus shape and the viscous losses. Furthermore, an effective propagation coefficient was obtained through dimensionless analysis that is functionally dependent only on the micropillar geometry. The relationship is plotted in Figure 2. The work offers design guidelines to obtain optimal liquid propagation rates on micropillar surfaces.
The current model obtained an average driving pressure during the propagation process. More specifically, two distinct time scales were observed as the liquid front advanced on the bottom surface between pillars or wetting the sides of the pillars. When the height of the pillars is smaller than the period of the pillar array, the former time scales dominate and our model overestimates the propagation rate. Future work will focus on the detailed dynamics of the liquid front.
References
- H.-H. Cui and K.-M. Lim, “Pillar array microtraps with negative dielectrophoresis,” Langmuir, vol. 25(6), p. 3336, 2009. [↩]
- S. Nagrath, L.V. Sequist, S. Maheswaran, D.W. Bell, D. Irimia, L. Ulkus, M.R. Smith, E.L. Kwak, S. Digumarthy, A. Muzikansky, P. Ryan, U.J. Balis, R.G. Tompkins, D.A. Haber, and M. Toner, “Isolation of rare circulation tumour cells in cancer patients by microchip technology,” Nature, vol. 450(7173), p. 1235, 2007. [↩]
- Y. Nam, S. Sharratt, C. Byon, S.J. Kim and Y.S. Ju, “Fabrication and Characterization of the Capillary Performance of Superhydrophilic Cu Micropost Arrays,” Journal of Microelectromechanical Systems, Vol. 19(3), p. 581, 2010 [↩]
- H. Brinkman, “A calculation of the viscous force exerted by a flowing fluid on a dense swarm of particles,” Applied Scientific Research, vol. 1, p. 27, 1949. [↩]
- A.S. Sangani and A. Acrivos, ” Slow flow past periodic arrays of cylinders with application to heat transfer,” International Journal of Multiphase Flow, Vol. 8(3), p. 193, 1982. [↩]