Measuring Single-cell Density
- Category: MEMS & BioMEMS
- Tags: scott manalis
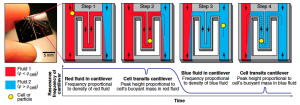
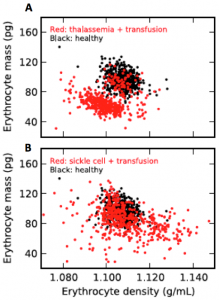
We have used a microfluidic mass sensor to measure the density of single living cells. By weighing each cell in two fluids of different densities (see Figure 1), our technique measures the single-cell mass, volume, and density of approximately 500 cells per hour with a density precision of 0.001 g mL−1. We observe that the intrinsic cell-to-cell variation in density is nearly 100-fold smaller than the mass or volume variation. As a result, we can measure changes in cell density indicative of cellular processes that would be otherwise undetectable by mass or volume measurements. Here, we demonstrate this with four examples: identifying erythrocytes infected with Plasmodium falciparum malaria in a culture, distinguishing transfused blood cells from a patient’s own blood (as in Figure 2), identifying irreversibly sickled cells in a sickle cell patient, and identifying leukemia cells in the early stages of responding to a drug treatment. These demonstrations suggest that the ability to measure single-cell density will provide valuable insights into cell state for a wide range of biological processes.
- Figure 1: Using the SMR (Left) to measure the buoyant mass of a cell in two fluids of different densities. Measurement starts with the cantilever filled with any buffer or media less dense than the cell (red, step 1). The density of the red fluid is determined from the baseline resonance frequency of the cantilever. When a cell passes through the cantilever (step 2), the cell’s buoyant mass in the red fluid is calculated from the height of the peak in the resonance frequency. The direction of fluid flow is then reversed, and the resonance frequency of the cantilever drops as the cantilever fills with a fluid denser than the cell (blue, step 3). The cell’s buoyant mass in the blue fluid is measured as the cell transits the cantilever a second time (step 4). From these four measurements of fluid density and cell buoyant mass, the absolute mass, volume, and density of the cell are calculated.
- Figure 2: A) Single erythrocyte mass vs. density for an individual with suspected thalassemia who also received a transfusion of normal (nonthalassemic) blood 4 days prior to collection (red; n = 502 cells) compared to a random nonthalassemic, nontransfused individual (black; n = 502 cells). The patient’s own erythrocytes (red) are offset from a normal patient’s erythrocytes (black), except for a few normal erythrocytes the thalassemic patient received during the transfusion (red points clustered on black points). B) Erythrocytes from an individual with sickle-cell anemia who also received a blood transfusion 35 days before collection (red; n = 502 cells) compared to the same nontransfused individual as in A (black; n = 502 cells). The widening distribution of erythrocyte densities in sickle cell anemia is consistent with previous studies, with denser cells likely representing irreversibly sickled cells.
- W. H. Grover, A. K. Bryana, M. Diez-Silvac, S. Suresh, J. M. Higgins, and S. R. Manalis, “Measuring single-cell density,” Proc. National Academy of Sciences, vol. 108, no. 27, pp. 10992-10996, 2011.

